This report covers Melleka Marketing's management of Vegamour's Google Ads account, breaking down performance before and after the September 4 acquisition close. Each section walks through the strategic decisions, results, and what is being done to course-correct.
Google Ads uses a conversion attribution model where purchases are credited back to the date the ad was clicked, not the date the purchase occurred. This means:
- The most recent 7 days (Sep 16-22) will always appear lower because conversions are still being attributed back to those click dates. The majority of conversions settle within 7 days of the click.
- Conversions continue to trickle in for up to 14 days after the initial click, sometimes longer for consideration-heavy purchases like hair care products.
- Data from Sep 1-15 is mostly settled and reflects near-final performance numbers.
When reviewing this report, treat Sep 16-22 data as directional only. The true performance will be 15-30% higher once all conversions fully attribute.
Side-by-side comparison of August (baseline) vs. September performance on core Google Ads campaigns. September figures include all campaigns. The Amazon Pilot campaign ($40,903) is tracked separately because its revenue is attributed within the Amazon marketplace, not Google Ads. Video Views ($33,039) is part of our intentional top-of-funnel brand awareness strategy for Q4 preparation. Detailed breakdowns are in Section 9.
August (Baseline)
September (Excl. Amazon Pilot)
September (All Campaigns)
The decline from August's 2.68x baseline to September's 1.62x (all campaigns) is driven by several factors: post-Labor Day demand pull-forward, conversion lag depressing the most recent data, increased NCAC spending to grow the new customer base ahead of Q4, and the Amazon Pilot campaign ($40,903 spend with revenue tracked on the Amazon side). Video Views ($33,039) is an intentional top-of-funnel strategy for Q4 holiday preparation. The NCAC strategy launched August 14, and our combined ROAS+NCAC approach peaked in late August before we began allocating approximately $3,700/day to Demand Gen and Video Views for brand awareness. Section 4 covers the NCAC strategy in detail.
August represented the peak of our combined ROAS + NCAC strategy. Melleka began managing Vegamour's Google Ads on April 15. The NCAC strategy was introduced on August 14 based on Google team recommendations, and reached its strongest performance in late August, before we began allocating approximately $3,700/day to top-of-funnel campaigns (Demand Gen and Video Views) for Q4 brand awareness. Here is the full-month performance across all Google Ads campaigns.
August Campaign Breakdown
| Campaign | Spend | Revenue | ROAS | Conv |
|---|---|---|---|---|
| Branded Search USA | $87,180 | $317,908 | 3.65x | 3,013 |
| Shopping USA | $45,679 | $133,066 | 2.91x | 1,401 |
| PMax | Hair Serums | $25,628 | $65,342 | 2.55x | 622 |
| Shopping USA | NCAC | $23,987 | $29,704 | 1.24x | 314 |
| PMax - Shampoo Conditioner | $21,154 | $53,269 | 2.52x | 583 |
| Subscription | PMax | $19,110 | $63,714 | 3.33x | 709 |
| Scalp Duo | PMax | $18,559 | $58,544 | 3.16x | 621 |
| Male | Hair Serum | PMax | $17,023 | $37,663 | 2.21x | 414 |
| PMax | Hair Serums | NCAC | $12,001 | $15,359 | 1.28x | 151 |
| PMax - Shampoo | NCAC | $8,316 | $8,169 | 0.98x | 99 |
| Demand Generation | $7,899 | $7,569 | 0.96x | 149 |
| Hair Quiz | PMax | NCAC | $6,696 | -- | -- | -- |
| Other Campaigns | $10,953 | $27,419 | 2.50x | -- |
| Total August | $304,584 | $817,724 | 2.68x | -- |
New Customer Acquisition Cost (NCAC) measures how much we spend to acquire a customer who has never purchased from Vegamour before. This is different from overall CPA or ROAS, which blends both new and returning customers together.
The Problem: Low New Customer Ratio
In discussions with the Google Ads team (Google's dedicated account reps) during August, they flagged that Vegamour's new customer ratio was approximately 15%. This meant roughly 85% of attributed purchases were coming from returning/existing customers. While this maintained a high ROAS, it signaled that the Google Ads campaigns were primarily re-capturing existing demand rather than growing the customer base.
The Strategic Shift
Based on this feedback, we launched our NCAC strategy on August 14. Our dual-strategy approach: Our dual-strategy approach:
- Shopping USA | NCAC
- PMax | Hair Serums | NCAC
- PMax - Shampoo | NCAC
- Hair Quiz | PMax | NCAC
Goal: Acquire new customers. Expected lower ROAS but expands the customer base for long-term LTV.
- Branded Search USA
- Shopping USA
- PMax | Hair Serums
- PMax - Shampoo Conditioner
- Subscription | PMax
- + Other product PMax campaigns
Goal: Maintain strong ROAS and capture existing demand.
NCAC Campaign Performance
| Period | NCAC Spend | New Customers | NCAC (Cost/New Customer) | NCAC Campaign ROAS |
|---|---|---|---|---|
| August (Full Month) | $51,000 | 563 | $91 | 1.04x |
| September 1-22 | $46,850 | 489 | $96 | -- |
When looking at NCAC campaigns in isolation, the cost per new customer is approximately $96 in September. However, when you look at the blended account-level new customer acquisition cost (total spend divided by estimated new customers across all campaigns), the number climbs significantly higher because Branded Search and other campaigns also consume budget while primarily serving returning customers.
This is expected behavior. NCAC campaigns are designed to run at a higher cost because they target users who have never purchased before. The LTV of these new customers (repeat purchases, subscriptions) typically pays back the higher acquisition cost over 3-6 months.
We split September into three distinct periods to show how performance evolved and where the declines occurred.
Period Comparison (Primary Conversion Value)
| Period | Spend | Revenue | ROAS | Daily Avg Spend | |
|---|---|---|---|---|---|
| Sep 1-7 (Labor Day) | $141,490 | $330,592 | 2.34x | $20,213 | 7.59x |
| Sep 8-19 (Post-Labor Day) | $189,141 | $239,043 | 1.26x | $15,762 | 4.80x |
| Sep 20-22 (Lag Zone)* | $39,541 | $30,977 | 0.78x* | $13,180 | 3.21x* |
| Full Sep 1-22 | $375,174 | $600,612 | 1.62x | $17,053 | 5.69x |
*Sep 20-22 data is heavily impacted by conversion lag. These numbers will increase 15-30% as conversions attribute over the next 7-14 days.
Daily Revenue Trend (Primary Conversion Value)
Bar height represents daily primary conversion value. Dates shown are September days.
Full campaign breakdown for September 1-22. Sorted by spend. Amazon Pilot is separated at the bottom as its revenue is attributed on the Amazon side. Video Views is included in the core breakdown as part of our planned top-of-funnel strategy.
Core Campaigns (Comparable to August)
| Campaign | Spend | Revenue | ROAS | Clicks | CPC |
|---|---|---|---|---|---|
| Branded Search USA | $71,357 | $286,975 | 4.02x | 14,288 | $4.99 |
| Shopping USA | $38,992 | $71,092 | 1.82x | 9,030 | $4.32 |
| Scalp Duo | PMax | $16,073 | $32,146 | 2.00x | 7,102 | $2.26 |
| PMax - Shampoo Conditioner | $14,802 | $18,229 | 1.23x | 4,244 | $3.49 |
| PMax - Shampoo | NCAC | $14,393 | $13,339 | 0.93x | 4,930 | $2.92 |
| Shopping USA | NCAC | $13,862 | $13,643 | 0.98x | 4,452 | $3.11 |
| PMax | Hair Serums | NCAC | $12,793 | $10,240 | 0.80x | 4,587 | $2.79 |
| Subscription | PMax | $12,748 | $14,552 | 1.14x | 14,463 | $0.88 |
| Non-Brand Search USA | $12,682 | $8,419 | 0.66x | 2,473 | $5.13 |
| PMax | Hair Serums | $12,288 | $23,334 | 1.90x | 3,324 | $3.70 |
| GRO Ageless | PMax | $11,568 | $29,761 | 2.57x | 3,742 | $3.09 |
| Male | Hair Serum | PMax | $9,379 | $13,432 | 1.43x | 8,389 | $1.12 |
| Hair Quiz | PMax | NCAC | $5,803 | -- | -- | 4,734 | $1.23 |
| Labor Day 26' | PMax | $5,656 | $12,068 | 2.13x | 5,862 | $0.96 |
| PMax | Lash Serum | $3,316 | $5,854 | 1.77x | 1,119 | $2.96 |
| Demand Generation | $41,085 | $20,931 | 0.51x | 94,909 | $0.43 |
| Other (Hydr8, Storefront, Style Wand, etc.) | $6,437 | $7,595 | 1.18x | -- | -- |
| Core Campaign Total | $301,232 | $599,142 | 1.99x | -- | -- |
Top-of-Funnel / Brand Awareness
| Campaign | Spend | Revenue | ROAS | Note |
|---|---|---|---|---|
| Video Views (Launched 9/4) | $33,039 | $279 | 0.01x | Intentional brand awareness for Q4 prep |
Amazon Pilot (Revenue Attributed on Amazon Side)
| Campaign | Spend | Revenue (in Google) | ROAS (in Google) | Note |
|---|---|---|---|---|
| Amazon Pilot | Demand Gen | $40,903 | $1,192 | 0.03x | Actual sales revenue tracked in Amazon, not Google |
Breaking down the four dedicated NCAC campaigns by the two key September periods.
Sep 1-7 (NCAC Campaigns Only)
| Campaign | Spend | Revenue | ROAS | Primary Conv | NCAC |
|---|---|---|---|---|---|
| Shopping USA | NCAC | $7,547 | $6,746 | 0.89x | 86 | $88 |
| PMax - Shampoo | NCAC | $5,539 | $7,049 | 1.27x | 82 | $68 |
| PMax | Hair Serums | NCAC | $4,863 | $6,545 | 1.35x | 74 | $66 |
| Hair Quiz | PMax | NCAC | $1,455 | $3,595 | 2.47x | 47 | $31 |
| NCAC Total (Sep 1-7) | $19,404 | $23,935 | 1.23x | 290 | $67 |
Sep 8-19 (NCAC Campaigns Only)
| Campaign | Spend | Revenue | ROAS | Primary Conv | NCAC |
|---|---|---|---|---|---|
| PMax - Shampoo | NCAC | $7,418 | $5,726 | 0.77x | 55 | $135 |
| PMax | Hair Serums | NCAC | $6,723 | $3,181 | 0.47x | 34 | $198 |
| Shopping USA | NCAC | $6,174 | $6,620 | 1.07x | 98 | $63 |
| Hair Quiz | PMax | NCAC | $2,561 | $2,957 | 1.15x | 39 | $66 |
| NCAC Total (Sep 8-19) | $22,876 | $18,484 | 0.81x | 226 | $101 |
NCAC-only campaign performance was solid during the Labor Day period ($67/new customer) and weakened post-Labor Day ($101/new customer), mirroring the overall account trend. The NCAC campaigns by design run at a lower ROAS since they target net-new customers, but the increase from $67 to $101 per new customer tracks with the broader post-promotional demand dip.
In September, we intentionally allocated approximately $3,700/day to top-of-funnel brand awareness campaigns to build audience pools ahead of the Q4 holiday season. These campaigns are optimized for reach and engagement, not direct purchases, so their direct ROAS will naturally be lower.
Optimized for video views to warm up new audiences for Black Friday, Cyber Monday, and holiday shopping. Low direct ROAS is expected and by design.
Driving mid-funnel engagement to build retargeting pools and brand familiarity ahead of Q4 peak season.
The beauty/personal care industry sees its highest conversion rates during October through December. Investing in brand awareness now means these warmed-up audiences will be significantly cheaper to convert during Black Friday, Cyber Monday, and the holiday gift-giving season. The payoff from August and September top-of-funnel spend is designed to materialize in Q4.
The Amazon Pilot campaign drives purchases through Amazon's marketplace. Revenue from these sales is tracked and attributed within Amazon's reporting system, not Google Ads. The near-zero ROAS shown in Google Ads does not reflect the actual performance of this campaign.
This campaign drives users to purchase on Amazon. The revenue from those purchases is attributed to Amazon's own reporting, not Google Ads. The Google Ads ROAS appears near-zero because the actual sales happen in Amazon's ecosystem. This spend should be evaluated within Amazon's reporting, not the Google Ads baseline.
Recognizing the post-Labor Day softening and the need to stabilize ROAS ahead of Q4, we have begun the following adjustments:
Google's team proposed a specific budget allocation (shown below) that pushed heavily into Non-Brand Search (19%) and DemandGen (20%) while reducing PMax to 25%. We are keeping DemandGen and Video Views as-is since they serve our top-of-funnel strategy, but we are not fully adopting Google's recommendation to reduce PMax. PMax has been our workhorse, consistently delivering the strongest ROAS. Instead of shifting budget away from PMax toward Non-Brand Search as Google proposed, we are redirecting budget into our strongest-performing campaigns, including PMax and our proven NCAC campaigns that are delivering efficient new customer acquisition.
Google's Proposed Budget Allocation
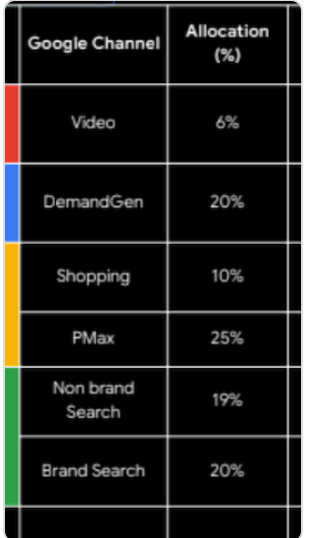
We are selectively adopting this framework: keeping top-of-funnel (Video, DemandGen) as-is, but maintaining PMax as our primary driver rather than shifting heavily to Non-Brand Search.
We are not abandoning the NCAC strategy entirely. New customer acquisition remains critical for long-term growth. However, we are reducing the budget allocation to NCAC campaigns and monitoring NCAC cost closely. Target: keep NCAC under $100 per new customer while the broader market stabilizes.
The Sep 8-19 period data will continue to improve as late conversions attribute. We are tracking this daily to determine how much of the apparent decline is real vs. lag-driven.
Despite the September softness, the Q4 holiday season (October through December) historically produces the highest conversion rates and ROAS for beauty/personal care brands. The brand awareness and NCAC investments made in August-September are designed to pay off during this peak period by warming up new audiences ahead of Black Friday, Cyber Monday, and holiday gift-giving season.